


Monthly Flagler County Waterfront Sales Reports & Florida Realtors® News
Flagler County Saltwater Canal Home Sales Report Summary October 2017
/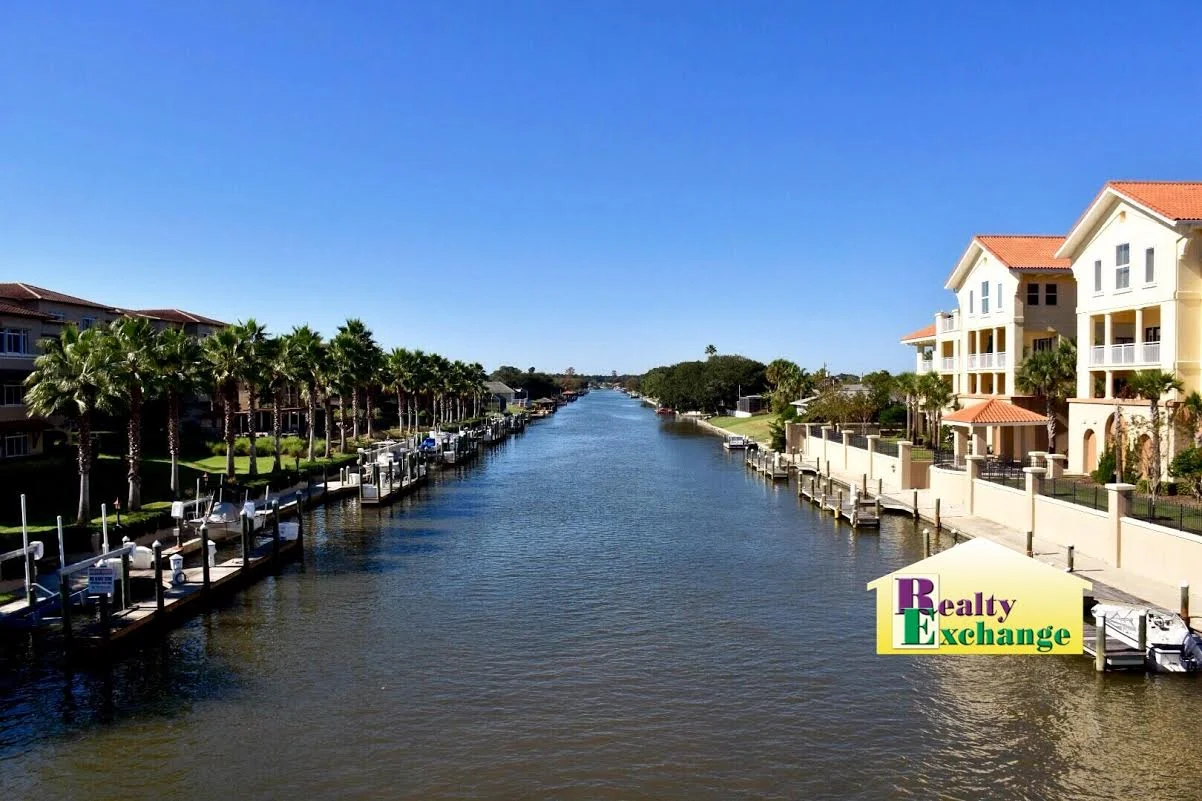
Get the latest Real Estate info on the Saltwater Canal in Palm Coast & Flagler County.
Read MoreNAR: U.S. Home Prices Rise 5.3% in 3Q
/NAR: U.S. home prices rise 5.3% in 3Q
CHICAGO – Nov. 2, 2017 – Severely lacking inventory levels across the country pinched sales growth and kept home prices rising at a steady clip in nearly all metro areas in the third quarter, according to the latest quarterly report by the National Association of Realtors® (NAR).
The national median existing single-family home price in the third quarter was $254,000, which is up 5.3 percent from the third quarter of 2016 ($241,300). The median price during the second quarter increased 6.1 percent from the second quarter of 2016.
Single-family home prices last quarter increased in 92 percent of measured markets, with 162 out of 177 metropolitan statistical areas (MSAs) showing sales price gains compared with the third quarter of 2016. Fifteen areas (8 percent) recorded lower median prices from a year earlier.
Lawrence Yun, NAR chief economist, says the housing market's performance during the third quarter was underwhelming.
"The stock market's climb to new record highs, the continued stretch of outstanding job growth and mortgage rates under 4 percent kept homebuyer demand at a very robust level throughout the summer," says Yun. "Unfortunately, the pace of new listings was unable to replace what was quickly sold. Home shoppers had little to choose from, and many had outbid others in order to close on a home. The end result was a slowdown in sales from earlier in the year, steadfast price growth and weakening affordability conditions."
Yun says that price appreciation moderated a bit in the third quarter, but "home prices still far exceed incomes in several parts of the country – especially in the largest markets in the South and West where new home construction simply is not keeping up with job growth."
Nineteen metro areas in the third quarter (11 percent) experienced double-digit increases, down from 23 areas in the second quarter (13 percent). Overall, there were more rising markets in the third quarter compared to the second quarter, when price gains were recorded in 87 percent of metro areas.
Total existing-home sales, including single family and condos, slipped 3.1 percent to a seasonally adjusted annual rate of 5.39 million in the third quarter from 5.56 million in the second quarter, but they're still 0.2 percent higher than the 5.38 million pace during the third quarter of 2016.
At the end of the third quarter, there were 1.90 million existing homes available for sale, which was 6.4 percent below the 2.03 million homes for sale at the end of the third quarter in 2016. The average supply during the second quarter was 4.2 months – down from 4.6 months in the third quarter of last year.
Last quarter, the uptick in the national family median income ($71,775) did little to stave off continued weakness in affordability from the combination of higher mortgage rates and home prices compared to a year ago. To purchase a single-family home at the national median price, a buyer making a 5 percent downpayment would need an income of $55,142, a 10 percent down payment would require an income of $52,240, and $46,435 would be needed for a 20 percent downpayment.
"Affordability pressures are frustratingly occurring in places where jobs are plentiful and incomes are rising," says Yun. "Without a significant boost in new and existing inventory to alleviate price growth, job creation could slow in high cost areas in upcoming years if residents begin exiling to more affordable parts of the country."
The five most expensive housing markets in the third quarter were the San Jose, California metro area, where the median existing single-family price was $1,165,000; San Francisco, $900,000; Anaheim-Santa Ana, California, $790,000; urban Honolulu, $760,200; and San Diego, $607,000.
The five lowest-cost metro areas in the third quarter were Decatur, Illinois, $86,300; Youngstown-Warren-Boardman, Ohio, $88,900; Cumberland, Maryland, $96,400; Wichita Falls, Texas, $113,800; and Elmira, New York, $117,300.
Metro area condominium and cooperative prices – covering changes in 61 metro areas – showed the national median existing-condo price was $237,200 in the third quarter, up 5.4 percent from the third quarter of 2016 ($225,100). Ninety-three percent of metro areas showed gains in their median condo price from a year ago.
Regional breakdown
Total existing-home sales in the Northeast dropped 7.9 percent in the third quarter and are 0.5 percent below the third quarter of 2016. The median existing single-family home price in the Northeast was $283,800 in the third quarter, up 4.1 percent from a year ago.
In the Midwest, existing-home sales declined 3.3 percent in the third quarter and are 0.8 percent below a year ago. The median existing single-family home price in the Midwest increased 5.6 percent to $202,400 in the third quarter from the same quarter a year ago.
Existing-home sales in the South fell 4.4 percent in the third quarter but are 0.2 percent higher than the third quarter of 2016. The median existing single-family home price in the South was $226,100 in the third quarter, 5.5 percent above a year earlier.
In the West, existing-home sales increased 2.8 percent in the third quarter and are 1.9 percent above a year ago. The median existing single-family home price in the West increased 7.0 percent to $373,700 in the third quarter from the third quarter of 2016.
© 2017 Florida Realtors
Florida's Housing Market: Median Prices Up in Q 2017
/Fla.’s housing market: Median prices up in Q 2017
ORLANDO, Fla. – Nov. 2, 2017 – Florida's housing market in third quarter 2017 showed the impact of Hurricane Irma, which made landfall in the Keys on Sept. 10. The latest housing data released by Florida Realtors®reported higher median prices year-over-year, but fewer closed sales, pending sales and new listings due to the disruption in September's market caused by the hurricane. Closed sales of single-family homes statewide totaled 67,811 in 3Q 2017, down 5.5 percent over the 3Q 2016 figure.
"Florida's economic and jobs outlook continued to show momentum in the third quarter, despite the devastation and disruption caused by Hurricane Irma striking our state on Sept. 10,"said 2017 Florida Realtors®President Maria Wells, broker-owner with Lifestyle Realty Group in Stuart. "State officials reported that Florida's unemployment rate in September was 3.8 percent, which is lowerthan the U.S. unemployment rate of 4.2 percent, according to the Bureau of Labor Statistics. As expected, September's housing data reflected the negative impact that the hurricane had on existing home and condominium sales– which of course also factors into the 3Q 2017 numbers.
"To better understand what is happening in their local markets, consumers should work with a Realtor who knows the area and can help them accomplish their goals, whether that goal is buying a first home or selling one they've outgrown."
The statewide median sales price for single-family existing homes in 3Q 2017 was $240,000, up 6.7 percent from the same time a year ago, according to data from Florida Realtors Research department in partnership with local Realtor boards/associations. The statewide median price for condo-townhouse properties during the quarter was $172,000, up 7.5 percent over the year-ago figure. The median is the midpoint; half the homes sold for more, half for less.
Looking at Florida's condo-townhouse market, statewide closed sales totaled 26,366 during 3Q 2017, down 3.1 percent compared to 3Q 2016. The closed sales data reflected fewer short sales and foreclosures over the three-month period: Short sales for townhouse-condo properties declined 45.5 percent and foreclosures fell 52.9 percent year-to-year; short sales for single-family homes dropped 45.1 percent and foreclosures fell 49.6 percent year-to-year. Closed sales typically occur 30 to 90 days after sales contracts are written.
"Irma clearly left its mark on the third quarter numbers by temporarily halting business activity for a number of days in September," said Florida Realtors Chief Economist Dr. Brad O'Connor. "July and August, on the other hand, were fairly typical months relative to what we've been seeing over the past couple of years: modest growth in sales, strong growth in prices and a declining inventory of homes on the lower end of the price spectrum. We'll see a return to this pattern over the next couple of months."
In 3Q 2017, the median time to a contract (the midpoint of the number of days it tookfor a property to receive a sales contract during that time) was 37 days for single-family homes and 49 daysfor condo-townhouse properties.
Inventory was at a 3.8-months' supply in the second quarter for single-family homes and at a 5.5-months' supply for condo-townhouse properties, according to Florida Realtors.
According to Freddie Mac, the interest rate for a 30-year fixed-rate mortgage averaged 3.89 percent for 3Q 2017, significantly higher than the 3.45 percent average recorded during the same quarter a year earlier.
For the full statewide housing activity reports, go to the Florida Realtors Research & Statistics section on floridarealtors.org. Realtors also have access to local market stats (password protected) on Florida Realtors' website.
© 2017 Florida Realtors®
LendingTree Migration Study: More Homebuyers Heading South
/LendingTree migration study: More homebuyers heading south
CHARLOTTE, N.C. – Oct. 31, 2017 – LendingTree, an online loan marketplace, released the findings of its study on where residents in each state want to move. In the latest study, LendingTree says it discovered a southern tilt in preferences for those people looking outside their own state.
Florida was the No. 1 new destination for 18 of the 50 states. Of all purchase mortgage requests during the study's time period, 9.14% were for consumers looking to move to Florida. The Sunshine State has a history of bringing in visitors and new residents, particularly retirees.
The results reveal the most popular new destination for each state along with the percentage of out-of-state requests for that location.
States that love Fla. – % looking out-of-state– % of those looking at Fla.
- Vermont – 24.07% – 14.01%
- New York – 20.8% – 21.5%
- Connecticut – 19.09% – 22.5%
- Maryland – 18.94% – 13.0%
- New Jersey – 18.08% – 21.09%
- Illinois – 14.66% – 14.07%
- Pennsylvania – 13.47% – 17.14%
- Maine – 12.99% – 22.11%
- Iowa – 11.89% – 10.38%
- Wisconsin – 11.45% – 14.1%
- Kentucky – 11.11% – 15.81%
- Tennessee – 11.07% – 16.19%
- Alabama – 10.3% – 22.09%
- Indiana – 10.13% – 18.24%
- Georgia – 9.68% – 26.32%
- Ohio – 9.66% – 19.83%
- Michigan – 9.18% – 21.52%
- Texas – 7.46% – 10.49%
Texas had the highest percentage of residents looking to move within the state versus outside of the state. 92.54% of purchase mortgage requests from individuals in Texas were for properties within the state. The second location with the highest percentage of residents looking to move within the state was Michigan.
In contrast to Texas, Vermont had the lowest percentage of residents looking to stay in state. 75.93% of requests in Vermont were for properties within the state.
If individuals are looking to move outside of state, most don't want to go far.
More than half of the most popular new destination states border the current state. Of the states that the residents' most popular new location does not border their current state, 16 were Florida.
However, in a related but separate Moving Popularity Score Index, South Carolina edged out Florida, even if more people actually seem to be looking at the Sunshine State. In South Carolina, mortgage loan requests from out-of-state movers were 56 percent greater than suggested by its share of the national population.
Florida ranked second, however, followed by Delaware, North Carolina and Georgia, revealing a southern tilt in the preferences of out-of-state home buyers.
At the other end of the spectrum, home buyers were least attracted to South Dakota, which received just 71 percent of the loan requests its population would suggest. California, Minnesota, North Dakota and Hawaii complete the bottom five.
The popularity score for each state was created by dividing the percentage of all out-of-state mortgage requests for the state by the percentage total population each state represents. A score of 100 means a state receives loan requests proportional to its population, above 100 means a state is more popular than its share of the national population and below 100 means a state is less popular than its share of the national population.
Moving popularity score: Top 10
- South Carolina – 156
- Florida – 143
- Delaware – 139
- North Carolina – 135
- Georgia – 134
- Nevada – 125
- New Hampshire – 123
- Tennessee – 119
- West Virginia – 118
- Mississippi – 112
Moving popularity score: Bottom 10
- South Dakota –71
- California – 72
- Minnesota – 76
- North Dakota – 77
- Hawaii – 77
- New York – 79
- Illinois – 79
- Wisconsin – 82
- Arkansas – 83
- Massachusetts – 83
© 2017 Florida Realtors
Confidence Increased to its Highest Level in Almost 17 Years
/Confidence increased to its highest level in almost 17 years
NEW YORK – Oct. 31, 2017 – The Conference Board Consumer Confidence Index, which had improved marginally in September (an upward revision), increased again in October and hit a 17-year high.
The Index now stands at 125.9 (1985=100), up from 120.6 in September. The Present Situation Index increased from 146.9 to 151.1, while the Expectations Index that gauges attitudes about the economy six months in the future rose from 103.0 to 109.1.
"Consumer confidence increased to its highest level in almost 17 years (Dec. 2000, 128.6) in October after remaining relatively flat in September," says Lynn Franco, director of economic indicators at The Conference Board. "Consumers' assessment of current conditions improved, boosted by the job market which had not received such favorable ratings since the summer of 2001. Consumers were also considerably more upbeat about the short-term outlook, with the prospect of improving business conditions as the primary driver."
Franco says that this month's survey suggests that "the economy will continue expanding at a solid pace for the remainder of the year."
Current situation
Consumers' appraisal of present-day conditions improved in October. The percentage saying business conditions are "good" increased from 33.4 percent to 34.5 percent, while those saying business conditions are "bad" rose marginally from 13.2 percent to 13.5 percent.
Consumers' assessment of the job market was more upbeat. The percentage of consumers stating jobs are "plentiful" increased from 32.7 percent to 36.3 percent, while those claiming jobs are "hard to get" decreased slightly from 18.0 percent to 17.5 percent.
Expectations
Consumers' optimism about the short-term outlook also rose in October. The percentage of consumers expecting business conditions to improve over the next six months increased from 20.9 percent to 22.2 percent, while those expecting business conditions to worsen decreased from 9.6 percent to 6.9 percent.
Consumers' outlook for the job market, however, was somewhat less favorable than in September. The proportion expecting more jobs in the months ahead decreased marginally from 19.2 percent to 18.9 percent; however, those anticipating fewer jobs declined from 13.0 percent to 11.8 percent.
Regarding their short-term income prospects, the percentage of consumers expecting an improvement decreased marginally from 20.5 percent to 20.3 percent, however, the proportion expecting a decrease declined from 8.6 percent to 7.4 percent.
The monthly Consumer Confidence Survey, based on a probability-design random sample, is conducted for The Conference Board by Nielsen. The cutoff date for the preliminary results was October 18.
© 2017 Florida Realtors
NAR: First-time Buyers Stifled by Low Supply, Affordability
/NAR: First-time buyers stifled by low supply, affordability
WASHINGTON – Oct. 30, 2017 – Despite solid interest in buying a home – sparked by steady job gains, record low mortgage rates and higher rents – the severe drought in housing supply in much of the country over the past year accelerated price growth and kept many first-time buyers out of the market, according to the National Association of Realtors®' (NAR) 2017 Profile of Home Buyers and Sellers.
The profile also identified numerous current consumer and housing trends, including mounting student debt balances and smaller downpayments; increases in single female and trade-up buyers; the growing occurrence of buyers paying the list price or higher; and the fact that nearly all respondents use a real estate agent to buy or sell a home, which kept for-sale-by-owner transactions at an all-time low of 8 percent for the third straight year.
In this year's survey, the share of sales to first-time home buyers inched backward to 34 percent (35 percent in 2016) – the fourth lowest share since 1981. In the 36-year history of NAR's survey, the long-term average of first-time buyer transactions is 39 percent.
"The dreams of many aspiring first-time buyers were unfortunately dimmed over the past year by persistent inventory shortages, which undercut their ability to become homeowners," says Lawrence Yun, NAR chief economist. "With the lower end of the market seeing the worst of the supply crunch, house hunters faced mounting odds in finding their first home. Multiple offers were a common occurrence, investors paying in cash had the upper hand, and prices kept climbing, which yanked homeownership out of reach for countless would-be buyers.
"Solid economic conditions and millennials in their prime buying years should be translating to a lot more sales to first-timers, but the unfortunate reality is that the nation's homeownership rate will remain suppressed until entry-level supply conditions increase enough to improve overall affordability."
Other key findings and notable trends of buyers and sellers this year
Student debt balances continue to grow
Of all first-time buyers, 41 percent indicated they have student debt (40 percent in 2016). The typical debt balance also increased ($29,000 from $26,000 in 2016), and over half owe at least $25,000. Additionally, of the 25 percent who said saving for a downpayment was the most difficult task in the buying process, 55 percent said student debt delayed saving for their home purchase.
"NAR survey findings on student debt released earlier this fall revealed that an overwhelming majority of millennials with student debt believe it's delaying their ability to buy a home, and typically for seven years," says Yun. "Even in markets with a plethora of job opportunities and higher pay, steep rents and home prices make it extremely difficult to put savings aside for a down payment."
Single females make up larger share of sales
Solid job prospects, higher incomes and improving credit conditions translated to continued momentum in the growing share of single female buyers. At 18 percent (matches highest since 2011), single women were the second most common household buyer type behind married couples (65 percent). Furthermore, single women purchased slightly more expensive homes than single men despite earning less. The overall share of single male buyers (7 percent) remained below unmarried couples (8 percent) for the second straight year.
Downpayment amounts decrease for first-timers, rise for repeat buyers
The ongoing climb in home prices pulled the typical downpayment for first-timers to 5 percent this year (6 percent in 2016), which matches the lowest since 2013.
Meanwhile, higher home values likely gave more sellers the wherewithal to use the cash from their recent sale to make a bigger downpayment on their new home purchase (14 percent; 11 percent in 2016). Repeat buyers' sales proceeds from their previous purchase (55 percent) surpassed their own personal savings (50 percent) this year as a larger source of their downpayment.
Personal savings ranked first for first-time buyers as the primary source of their downpayment, followed by a gift from a friend or relative (25 percent; 24 percent in 2016). Over half of first-timers said it took a year or more to save for a downpayment, and 25 percent said saving was the most difficult task in the entire buying process.
Age of first-timers stays flat; climbs to new survey high for repeat buyers
For the second straight year, the median age of first-time buyers was 32 years old. First-time buyers had a higher household income ($75,000) than a year ago ($72,000) and purchased a slightly smaller home (1,640-square-feet; 1,650-square-feet in 2016) that was more expensive ($190,000; $182,500 in 2016). Fewer first-time buyers purchased a home in an urban area (17 percent; 20 percent in 2016).
The age of repeat buyers increased to an all-time survey high this year (54 years old; 52 years old in 2016) as older households, perhaps with plans to stay in the workforce longer but with an eye towards retirement, felt more comfortable about buying. Overall, repeat buyers had roughly the same household income as last year ($97,500; $98,000 in 2016) and purchased a 2,000-square-foot home (unchanged from last year) costing $266,500 ($250,000 in 2016).
Supply scarcity leads to increase in buyers paying list price or higher
Underscoring the supply and demand imbalances prevalent in many parts of the country, 42 percent of buyers paid the list price or higher for their home, which is up from a year ago (40 percent) and a new survey high since tracking began in 2007. Buyers in the West were the most likely (51 percent) to pay at or above list price.
"Many of those in the market to buy a home this year had little room to negotiate," says Yun. "Listings in the affordable price range drew immediate interest, and the winning offer often times had to waive some contingencies or come in at or above asking price to close the deal."
Buyers report less difficulty obtaining a mortgage
The improving financial health of borrowers and a slight ease in credit standards are leading to a smoother process in obtaining a mortgage. Fewer buyers (34 percent) compared to a year ago (37 percent) indicated that the mortgage application and approval process was somewhat or much more difficult than they expected.
Fifty-eight percent of buyers financed their purchase with a conventional mortgage, and 34 percent of first-time buyers took out a low-down payment Federal Housing Administration-backed mortgage, which is up from 33 percent last year but down from 46 percent five years ago.
Nearly all buyers choose a single-family home in a suburban location
A majority of buyers continue to choose a home in a suburb, small town or rural area (85 percent) as opposed to an urban one (13 percent; 14 percent in 2016). Eighty-three percent of buyers purchased a detached single-family home, which for the third straight year remains the highest share since 2004 (87 percent). Purchases of multi-family homes, including townhouses and condos, were at 11 percent.
Most buyers search for homes online … and use a real estate agent
This year's survey data continues to show that the internet (95 percent) and real estate agents (89 percent) remain the top two information sources used during buyers' home search. Overall, 87 percent of buyers ended up purchasing their home through a real estate agent (88 percent in 2016), and finding the right property to buy and help negotiating the terms of the sale were the top two things buyers wanted most from their agent.
Even for those who found the home they purchased online, nearly all still closed on it with the help of an agent (88 percent).
"It's no surprise a majority of first-time buyers indicated that the top benefits received from their agent were help understanding the buying process (83 percent), pointing out unnoticed property features or faults (60 percent), and negotiating better sales terms (51 percent)," says NAR President William E. Brown. "Realtors over the past year have helped buyers – and especially first-timers – navigate extremely competitive market conditions where the need to be prepared and act quickly has been paramount to the success of purchasing a home."
Homeowner tenure at all-time high; equity and share of repeat buyers climbs
The typical seller over the past year was 55 years old, had a higher household income ($103,300) than last year ($100,700) and was in the home for 10 years before selling – matching the all-time high set both in 2014 and a year ago. Prior to 2009, sellers consistently lived in their home for a median of six years before selling.
With home values steadily rising over the past several years, sellers realized a median equity gain of $47,500 ($43,100 in 2016) – a 26 percent increase (24 percent last year) over the original purchase price. Homes sold after 21 years of ownership had the largest equity gain (104 percent), while those who purchased six or seven years ago saw a larger return (27 percent) than those who purchased between eight and 15 years ago (14 percent to 18 percent).
The percent share of buyers trading up increased for the third straight year, rising to 52 percent from 46 percent in 2016. In 2014, 40 percent of buyers purchased a bigger home.
"The decline in first-time buyers and uptick in repeat buyers trading up to a larger home reflects the more favorable conditions for home shoppers at the upper end of the market, where listings are more plentiful and sales have been consistently higher over the past year," says Yun.
Seller use of an agent remains at all-time high; FSBOs at record low
Sellers' use of a real estate agent this year remained at an all-time high of 89 percent. This in turn – for the third straight year – held for-sale-by-owner sales to their lowest share (8 percent) in the survey's history.
An overwhelming majority of sellers were satisfied with the selling process (88 percent), with most also indicating that they would definitely or probably use their agent again or recommend him or her to others (85 percent).
"Homeowners understand the value, and seek the expertise and guidance Realtors bring to the table when it's time to sell their home," says Brown. "Despite incredibly favorable market conditions for sellers – where finding interested buyers was not a problem – nearly all turned to a Realtor to help assist them through the intricacies of listing their home on the market, accepting offers, negotiating the sales price and closing the deal."
© 2017 Florida Realtors
HUD Cuts Red Tape to Speed Hurricane Recovery
/HUD cuts red tape to speed hurricane recovery
WASHINGTON – Oct. 30, 2017 – The U.S. Department of Housing and Urban Development (HUD) announced a package of 19 regulatory and administrative waivers aimed at helping communities to accelerate their recovery from Hurricanes Harvey, Irma and Maria.
While HUD granted a number of individual waivers after earlier disasters, HUD says the latest announcement is one of the largest collections of regulatory and administrative waivers ever issued by the department at one time.
"The recent storms are unprecedented so it makes sense that our response be unprecedented as well," says Assistant Secretary for Community Planning and Development Neal Rackleff. "We must be as flexible as we possibly can to help our state and local partners at a time they need our help the most."
The relief covers the following HUD programs:
- The Community Development Block Grant (CDBG) Program
- HOME Investment Partnerships (HOME) Program
- Housing Opportunities for Persons with AIDS (HOPWA) Program
- Emergency Solutions Grant (ESG) Program.
To expedite the use of funds, HUD says that state and local partners can access a waiver through a new simplified notification process.
HUD's latest relief efforts
- HUD is allowing an abbreviated public comment requirement on changes to a grantee's community redevelopment plans. Upon notification, HUD will reduce the customary 30-day comment period to seven days.
- Hurricanes Harvey, Irma and Maria destroyed communications networks, particularly in the Commonwealth of Puerto Rico and the U.S. Virgin Islands. Therefore, HUD is waiving the normal communication requirements and allowing these grantees to determine what constitutes reasonable notice and opportunity to comment.
- The hurricanes also caused extensive damage and destruction to the housing stock in certain impacted areas. To accelerate construction, HUD is suspending normal rules to enable CDBG grantees to replace affordable housing units that were lost as a result of the hurricanes and flooding.
- HUD will suspend a cap limiting CDBG expenditures for public services to 15 percent. HUD will temporarily allow CDBG grantees to pay for additional support services for individuals and families affected by the hurricanes. Services could include, but not be limited to, the provision of food, emergency shelter, case management and related services to help residents in declared-disaster areas until long-term recovery resources become available.
HUD offers more info online about the regulatory and administrative changes.
© 2017 Florida Realtors
How Much Does Solar Energy Add to a Home's Value?
/How much does solar energy add to a home’s value?
TAMPA, Fla. – Oct. 27, 2017 – The U.S. Solar Market Value Report, a first-of-its-kind study, attempts to put a dollar value on home values before and after a solar-energy system has been installed. Energy Sense Financeand Sandia National Laboratories published the report with funding by the U.S. Department of Energy's SunShot Initiative.
Click here to download a full copy of the report.
The report is based on data collected from the PV Value tool that allows appraisers to attribute a value for solar energy systems on residential properties. The data included in the study was taken from three states where solar is commonly installed: California, Arizona and Massachusetts.
The report reveals that the mean value for a solar energy system in 2016 was: $3.93/watt in California, $2.17/watt in Massachusetts and $2.34/watt in Arizona.
The report also included valuations for older systems. It found that 12-year old solar energy systems that were part of a home sale in 2016 were worth 50 percent of the value of new systems that also transacted in 2016. That suggests that solar retains value over time as part of a home's value – a monetary savings in addition to the annual energy savings the homeowner already received.
© 2017 Florida Realtors
NAR: Pending Home Sales Flat in September
/NAR: Pending home sales flat in September
WASHINGTON (October 26, 2017) — Pending home sales were unchanged in September, but activity declined on an annual basis both nationally and in all major regions, according to the National Association of Realtors® (NAR).
The Pending Home Sales Index (PHSI), a forward-looking indicator based on contract signings, stood at 106.0 in September – unchanged from a downwardly revised August figure. The index is now at its lowest reading since January 2015 (104.7), and down 3.5 percent from a year ago. It has fallen on an annual basis in five of the past six months.
Lawrence Yun, NAR chief economist, says the quest to buy a home this fall continues to be a challenging endeavor for many home shoppers.
"Demand exceeds supply in most markets, which is keeping price growth high and essentially eliminating any savings buyers would realize from the decline in mortgage rates from earlier this year," says Yun. "While most of the country, except for the South, did see minor gains in contract signings last month, activity is falling further behind last year's pace because new listings aren't keeping up with what's being sold."
Yun says that Hurricane Irma "weighed on activity in the South, but similar to how Houston has rebounded after Hurricane Harvey, Florida's strong job and population growth should guide sales back to their pre-storm pace fairly quickly."
As has been the case most of the year, Yun says the ongoing supply constraints continue to squeeze prospective buyers the most at the lower end of the market. Last month, first-time buyers made up 29 percent of all transactions, which matched the lowest share in exactly two years. Furthermore, existing sales were down notably on an annual basis in the price range below $250,000, but up solidly the higher up the listing was in the price bracket.
"Buyers looking for a little relief from the stiff competition from over the summer may unfortunately be out of luck in the coming months," says Yun. "Inventory starts to decline heading into the winter, and many would-be buyers from earlier in the year are still on the hunt to find a home."
The PHSI in the Northeast rose 1.2 percent to 94.5 in September, but it's still 2.4 percent below a year ago. In the Midwest, the index climbed 1.4 percent to 102.9 in September, but it remains 2.5 percent lower than September 2016.
Pending home sales in the South decreased 2.3 percent to an index of 115.9 in September and are now 5.0 percent below last September. The index in the West grew 1.9 percent in September to 102.7, but is 2.9 percent below a year ago.
© 2017 Florida Realtors